You are here
How to Track the Impact of Research Data with Metrics
By Alex Ball (DCC), Monica Duke (DCC)
Published: 29 June 2015
Browse the guide below or download the PDF.
Contents
Why measure the impact of research data?
A key measure of the worth of research is the impact it has or, to put it another way, the difference it is making both within the academic community and beyond. In recent years funding bodies have placed increasing emphasis on monitoring the potential and actual impact of the research projects they fund, as distinct from evaluating the intrinsic academic quality and value of research outputs as judged solely by other academics.
Since 1997, the NSF has judged the merit of research proposals on their intellectual merit and their broader impact.[1] In the UK, impact plans became part of the bidding process for all Research Councils in 2009, though in 2010 the purpose of the plans was clarified by reformulating them as Pathways to Impact.[2] In this part of their proposals, researchers are asked to consider how they might maximise the academic, societal and economic impact of their research.
At the other end of the research lifecycle, the 2014 Research Excellence Framework (REF) in the UK included impact as an explicit element alongside outputs and environment.[3] Submissions were in the form of case studies of social, economic and cultural benefits and impacts arising from research activity. Furthermore, when the Higher Education Funding Council for England (HEFCE) – one of the agencies responsible for the REF – undertook a review of the role of metrics in research assessment in 2014-2015, it considered how they might be used to assess both the quality of academic research and its broader impact.[4]
There are many reasons underlying this emphasis on impact. For one, it provides tangible evidence of benefit to weigh against the costs of research. For another, it provides an engaging way of comparing peer research programmes across the globe, albeit through the lens of proxy indicators, when undertaking strategic decision-making or benchmarking. It is not, however, ideal for making comparisons across disciplines as each one has its own pattern of impact, operating over a different timescale. In order to accommodate these differences as far as possible, funders tend to take into account a wide variety of ways in which research can be influential. This means going beyond a traditional bibliometric analysis of academic outputs to consider how wider societal needs have been met by research efforts. Research can have impact by influencing practice or policy, generating wealth, driving industrial innovations, tackling pressing societal questions or problems, or meeting the needs of a particular community.
It is therefore in the interests of researchers and institutions to track the impact of their research. An obvious place to start is with the impact of research outputs, including datasets. Admittedly, the prospect of using quantitative measures for assessing impact is not without controversy. Social and political concerns include the encroachment on academic freedom and creativity, and the effects on the well-being of researchers of working in a culture of measurement.[5] The limitations of what is being measured must also be recognised: awareness is needed of the specific types of impact being recorded, which may not be comprehensive especially given how broad the consideration of impact could be. The output from tools for tracking impact must also be carefully considered. As discussed below, due to the immaturity of the area some of the measurements may not be comparable. A note of caution must be sounded if using derived data for decision making: knowledge of the strengths and weaknesses of different metrics must be taken into account.
Researchers can, however, start to use some metrics as indicators of impact and follow them up as potential leads that could become the basis of demonstrating impact in a case study. Furthermore, by monitoring usage of their shared datasets, researchers can get to know which forms of data preparation and data publication work best, and adjust their practices accordingly. By tracking who is reusing their data, researchers may uncover opportunities for collaboration from among their peers, and may identify communities who, even though they were not the original intended audience (e.g. the public), have an interest in the data.
Institutions can benefit from data usage monitoring when they come to
- plan for and monitor the success of the infrastructure providing access to the data, in particular to gauge capacity requirements in storage, archival and network systems;
- instigate promotional activities and celebrate data sharing and re-use successes by researchers at the institution;
- create special collections around popular datasets;
- meet funder requirements to safeguard data for the appropriate length of time since last use.[6]
As an example of the latter points, in October 2014, the Engineering and Physical Sciences Research Council (EPSRC) set out a clarification of its expectations of the research organisations it funds.[7] It explained that organisations are expected to log requests to access the data they hold, and recommended they also do likewise for data their researchers have deposited elsewhere (Expectation III). Not only are such logs ‘a valuable indicator of impact’, they along with other measures of interest[8] can inform decisions about data retention. In particular, EPSRC stated it did not expect a dataset to be retained if no interest has been shown in it for a period of 10 years (Expectation VII).
These considerations are all important in the wider movement to improve quality and transparency, increase efficiency, and widen the opportunities for academic research through data sharing. Narrative accounts of high-impact data sharing and re-use can be used to advocate cultural change. Meanwhile, data metrics may be used to incentivise data sharing within a framework of professional advancement and reward that recognizes data as a fundamental research output.[9]
![]()
Impact measurement concepts
Impact is, in its figurative sense, the effect or influence that one agent, event or resource has on another. It is distinct from, but related to, concepts such as attention (how many people know about the entity) and dissemination (how widely a resource has been distributed). When considering proposed metrics, it is therefore important to consider what exactly is being measured and the strength of the evidence it provides for the impact of the entity in which one is interested.[10]
For example, citation counts are often used as a measure of the influence that a paper has on subsequent literature in a discipline. They are not a true measure, as papers may be cited for reasons other than acknowledging influence (e.g. as part of a refutation, or to acknowledge an unused line of enquiry), but serve as a useful proxy measure. In aggregrate, citation counts can be used as a proxy measure for the impact of other entities – the authors, the funding body, and so on – but at a weaker level of confidence.
The h-index, for example, is a measure of researcher impact and productivity derived from the citation counts of papers.[11] Researchers have an index h if exactly h of their published papers have been cited h or more times. This way of aggregating the citation counts means that researchers have to produce highly cited papers in quantity in order to score highly; a large quantity of poorly cited papers or a one-off influential paper are not enough.
Another measure derived from citation counts is the Journal Impact Factor (JIF), which gauges the impact of a journal in a given year. It is defined as the mean number of citations received by the papers published by the journal in the preceding two years from papers published (in any journal) in the year in question. The official JIFs are calculated by Thomson Reuters from the papers indexed by Web of Knowledge, and published in the Journal Citation Reports (JCR) product.[12] Despite being a measure of the impact of a journal, not that of its constituent papers, it is often used as a proxy measure for the prestige of the journal, and thereby (controversially) of the impact of the authors whose papers are published in that journal.
There are compelling arguments against using the JIF in so simplistic a manner. It is no longer the case that it is prohibitively time consuming to apply metrics to articles and authors on an individual basis. Furthermore, measuring the impact of an entity through indirect means, as happens with both the JIF and the h-index, provides only an incomplete picture. This is one reason why funding bodies have so far been reluctant to use metrics directly, preferring narrative case studies that can explore the full range of possible impact. For example, Figure 1 shows the types of impact recognised by BBSRC in its Policy on Maximising the Impact of Research.[13] Specifically, data-related impact researchers can have includes
- reuse of data they have shared to derive new knowledge;
- incorporation of their data into larger datasets or data products;
- widespread use of software or workflows they have written.

Figure 1: The variety of impact recognised by the UK Biotechnology and Biological Sciences Research Council
No one metric can hope to represent fairly all these possibilities, so it is worth exploring the variety of metrics that can be used. As noted above, there are risks and concerns about reading too much into any given statistic, but metrics do provide an accessible way of uncovering evidence that might be suitable for use in an impact case study.
Traditionally, we have attempted to measure the impact of the journal in which that research was published as a proxy for the impact of the research itself. However, this method is becoming increasingly problematic as more research is created and disseminated digitally and in forms beyond the traditional journal article. – Andy Wesolek[14]
Citations of data
The most mature emerging model for measuring the impact of data is one that is analogous to the publication and citation of literature.[15] Going beyond mere data sharing, where data is simply made available (e.g. as files on a website), data publication implies that the data has entered a framework for checking its quality, ensuring it is fit for reuse, making it searchable and discoverable, and guaranteeing its long-term accessibility. The resulting dataset is given stable bibliographic information so that it can be reliably cited by other scholarly outputs. Such citations can be counted in the usual manner to provide evidence of the impact of the dataset, subject to the limitation described above.
The analogy can be taken further, as datasets can meaningfully make references as well as receive citations. One suggested formal mechanism for this is to package the data within a research object rich in metadata.[16] If this idea gains traction, derived data products could then cite the source data, with referencing between data products (or research objects) providing a complementary citing network alongside that of publications.
While direct citation of and between datasets is far from widespread, and may be considered an aspirational end goal, some disciplines are taking a transitional approach where citations are made instead to a data paper. This is a paper that describes the dataset and its collection without drawing any scientific conclusions from it. Such papers may be published in a special section of a regular journal, or in a dedicated data journal such as the Journal of Open Archaeology Data.[17] Citations of data papers may be interpreted as citations of the underlying dataset for the purposes of assembling evidence of impact.
In many disciplines, however, the dominant approach is the traditional one of citing the first paper to make use of the data, relying on that paper to indicate if and how the data has been shared. It is not usually possible, at least not without significant manual effort, to identify whether citations to such papers should count towards the impact of the argumentation and conclusions of the paper, the underlying dataset, or both. In such disciplines, therefore, citation counts are of little help as an indicator of data impact, so alternative indicators must be found.
Resolutions
Many datasets have been given persistent, unique identifiers to assist with unambiguous referencing, and many of the schemes in use are resolvable. In other words, there are bridge services that map the identifiers to one or more Internet locations.
One such scheme is the Digital Object Identifier (DOI), for which DataCite is the main Registration Agency for research datasets. Among the services it provides is DataCite Statistics,[18] which shows on a monthly basis the number of times the top ten DOIs for each prefix have been resolved to a URL. Account holders have access to resolution data for all the DOIs they manage. These statistics give an indication of how often references to the dataset have been followed.
Page views
Web servers log each interaction they have with a client, so by analysing the logs it is possible to count approximately how many times a webpage has been opened by a browser. Some sites additionally embed in their pages JavaScript code that notifies an analysis application each time a page is viewed. Either way, this statistic can be used to infer the level of interest in that page.
When datasets are made available online, best practice is to provide a corresponding webpage displaying a catalogue record for the dataset. At a minimum one would expect the page to display the dataset title, a statement of responsibility, a short description, and a download link (or instructions on how to gain access). The number of times the dataset catalogue page has been viewed gives an indication of the level of interest in the dataset, and the level of awareness of its existence.
Downloads
Web server logs can also be used to count the number of times a data file has been downloaded. This indicates a stronger level of interest in the data than can be inferred from a count of catalogue page views, since it implies a desire to look at the actual data, but the statistic alone does not reveal the use to which the downloaded data might be put.
At the time of writing the number of repositories and data archives that make download statistics openly available is quite small – one is VectorBase[19] – but several others are known to collect and use them internally.[20] For example, the UK Data Service Discover catalogue can put search results in order from most to least downloaded.
Social media links
Perhaps the alternative metrics closest to references in journal articles are those that measure the topicality of the dataset on social media platforms. If people are moved to share or discuss a dataset with friends, colleagues and the wider world, there is a likelihood it has affected them in some way, meaning it is worth looking closer for evidence of impact.
Twitter[21] is a social networking tool that enables users to send short messages known as ‘tweets’ to their followers. As they are limited to 140 characters, tweets lend themselves to immediate reaction and brief sentiments. A tweet referring to a piece of research might contain a link to, say, a research output, a project website or a blog post that discusses it, accompanied by a comment on it. Detecting tweets that relate to a dataset can be tricky, but a possible search strategy is to look for mentions of the dataset’s identifier or links to its catalogue page. Once a tweet has been found, for an accurate picture of the impact the dataset is having it is useful to consider whether the tone of the tweet is positive, negative or neutral, just as it is when analysing traditional citations. It can also be informative to track any ensuing conversation – replies or forwards (‘retweets’) – as these can indicate how far others agree with the sentiments of the original tweet. It should be noted that there is a cultural dimension to tweeting; for example, in some communities it is not considered a professional activity for academics.
Applying altmetrics to data could be even more useful than for papers; data not well cited, but much interest in how they are used #1amconf – Eleanor Beal (via Twitter)[22]
Social bookmarking and bibliographic services are not used quite so widely as Twitter, but are much less ‘noisy’ as a source of evidence of interest in scholarly outputs. Services such as Mendeley, CiteULike, BibSonomy and Delicious allow users to record online resources for their own reference or to recommend them to others.[23] While the functionality offered by each service differs, one can typically discover how many users have bookmarked a particular link or resource. Some, notably Digg and Reddit,[24] also provide information on how many users have up-voted or down-voted the resource; this may give an impression on whether the resource is having a positive impact or not.
Several blogging platforms use a system of linkbacks to track conversations between blogs. When a new post is written to Blog A about an old post in Blog B, Blog A sends a notification to Blog B. Blog B can use this information to incorporate an extract of the new post as a comment on the old one. If a data repository or archive is set up to receive linkbacks, it can use them to monitor where particular datasets are being mentioned among publishing platforms supporting the protocol.
Post-publication peer review
One proposed innovation in the field of scholarly communications is the use of post-publication peer review as a method of quality control. While it is has yet to establish itself as a practice, there are several places where such reviews may be found, such as Faculty of 1000 (both as an integral part of its own publications and as a service reviewing other literature) and PubPeer.[25] While the emphasis has to date been on reviewing journal papers, there are moves to apply the principle to datasets as well. The data papers submitted to data journal Earth System Science Data, for example, are given a brief internal review before being published in its companion title Earth System Science Data Discussions,[26] where anyone is able to submit a review. Only once the paper has satisfactorily passed this public review phase can it proceed for publication in the main journal.
While post-publication peer review is concerned with quality rather than impact, the text or nature of such reviews may reveal evidence of reuse. There are suggestions that data archives might invite those who have downloaded and reused their data to leave feedback on the dataset’s landing page.[27] Not only would this provide a scalable source of peer review and insights into what makes data reusable, it would also provide confirmation that other researchers had attempted to use the data and, in the case of successful reuse, that the data has made an impact.
![]()
Impact measurement services
Thomson Reuters Data Citation Index
Data Citation Index at a glance
- Counts formal and informal citations of datasets by papers
- For: researchers, librarians, funders
- Pricing: institutional subscription, price on application
- http://wokinfo.com/products_tools/multidisciplinary/dci/
In October 2012, Thomson Reuters launched the Data Citation Index (DCI) as part of its Web of Knowledge service.[28] It provides records at four levels of granularity: nanopublication, dataset, data study (a research activity producing one or more datasets) and repository. The records can be searched and filtered in various ways, in the same way as (and indeed in combination with) the other indices in Web of Knowledge. The records are linked so that, for example, from a repository record one can view records for the data studies and datasets held by that repository. Sample citations are also provided.
On each record, the DCI displays the number of times the entity has been cited in Web of Knowledge. Recognising the variety of ways in which datasets and repositories can be cited, the DCI counts not only entries in the reference list but also less formal citations that occur elsewhere in scholarly papers (for example, in the abstract or acknowledgements).
Selection for inclusion in the DCI is at the level of whole repositories rather than individual datasets or studies. The criteria used for selecting repositories include longevity, sustainability, activity (in terms of new data being deposited), metadata held for the data (ideally in English, with links to associated literature, funding information, and so on), and quality assurance procedures.[29]
ImpactStory
ImpactStory at a glance
- Collects altmetric statistics for a portfolio of scholarly outputs
- For: researchers
- Pricing: US$60 per annum
- https://impactstory.org/
ImpactStory allows researchers to build a profile to showcase their various academic activities.[30] After registration, users add to their profile their various scholarly outputs, such as articles, presentation slides, videos, data, or software. This can be done by quoting their respective URLs or identifiers including PubMed IDs and DOIs. ImpactStory then uses various external services to track metrics relevant to the impact of those resources.
Some of the metrics used are specific to the service used to host the resource. For example, ImpactStory tracks the number of times videos on Vimeo and YouTube have been viewed and ‘liked’, the number of times a GitHub repository has been forked, and the number of times resources in the Dryad data repository, Figshare, PLoS journals and SlideShare have been downloaded. Other metrics track interest in a resource independent of where it is hosted. The service can look up citation counts in Scopus, bookmark counts in Mendeley and CiteULike, and mentions on Facebook, Google+, Twitter, Wikipedia, and in blog posts. The metrics are used to compile reports on the interest shown in the user’s portfolio of outputs, highlighting the most popular resources and providing some aggregate statistics. These reports are typically emailed to the user on a weekly basis.
ImpactStory operates as a non-profit organisation registered in the USA. It grew out of a hackathon project, ‘total-impact’, that was developed at the 2011 Beyond Impact workshop. Since 2012 it has received funding from the Open Knowledge Foundation, the National Science Foundation, Jisc and the Sloan Foundation, and is also supported by registration fees of $60 per annum (at the time of writing in 2015). The data collected by the service is made open, unless restricted by third parties, and may be exported for single items or whole profiles at any time. The code and governance of the service are also open. Ideas for further development of the service are invited through a feedback forum, and users can vote for the ideas they would like the developers to prioritise.
Example
‘Mousing over’ elements of an ImpactStory profile reveals more information. The pop-up for Bik et al.’s 2012 dataset on benthic microbial eukaryote communities reveals it has received more Dryad views than 86% of the datasets from that year tracked by the service.[31]

PLoS Article-Level Metrics
Article-Level Metrics at a glance
- Collects altmetric statistics for PLoS articles; other publishers/repositories may use the same software
- For: researchers, institutions, funders
- Pricing: Free
- http://article-level-metrics.plos.org/alm-info/
In 2009, the Public Library of Science (PLoS) launched its Article-Level Metrics (ALM) service.[32] This compiles a set of impact indicators from PLoS’s own systems and various other services, and makes them available in both a visual way and via an application programming interface (API).
The metrics compiled include
- usage statistics (views and downloads) from PLoS and Pubmed Central;
- interactions (comments, notes, ratings) on the PLoS website;
- citations identified by Scopus, Web of Science and others;
- references made in social networks like Twitter and Facebook, on various blogging platforms, or on Wikipedia.
The metrics are displayed on the landing pages for PLoS articles, and can also be compiled into custom reports.[33]
PLoS released the source code for the ALM application in 2011.[34] It was used as the basis of the (now discontinued) ScienceCard service, which provided an author-centric view on the same data.[35] It was also taken up by other publishers and service providers, most significantly by CrossRef Labs, meaning statistics are available for many non-PLoS papers as well.[36]
While the implementations of the software so far have concentrated on papers, the software itself is resource-type agnostic, so could be applied to datasets.
PlumX
PlumX at a glance
- Collects altmetric statistics for an organisation’s scholarly outputs
- For: institutions, funders, publishers
- Pricing: institutional subscription, price on application
- http://plu.mx/
PlumX is the main product of Plum Analytics,[37] a company formed in 2011 and acquired by EBSCO at the start of 2014.[38] It aims to provide a more comprehensive picture of research impact than citations alone, and in particular to give insight into the impact that resources have in the period before the first citations are counted. The PlumX product is aimed at organisations rather than individuals, so Plum Analytics counts among its customers universities, corporations, publishers and funders, and reports rapid growth since the acquisition.
PlumX aggregates information from a wide range of external sources about the impact of research outputs, including datasets and source code as well as more traditional publications. The metrics are grouped into five categories:
- usage: the number of times the resource has been viewed or downloaded, the number of times a link to it (from Twitter or Facebook) has been clicked, the number of users contributing to it (on GitHub), the number of libraries that hold a copy;
- captures: the number of times the resource has been marked as being of interest (e.g. bookmarked on Delicious; added to a Mendeley library; followed, forked or watched on GitHub);
- mentions: the number of blog posts written about it, the number of comments made about it (on Facebook, Slideshare, YouTube, etc.), the number of reviews received (on Amazon or Goodreads);
- social media: the number of times the resource has been recommended (e.g. by means of ‘likes’ on Facebook, ‘+1s’ on Google+, net upvotes on Reddit, tweets);
- citations: the number of citations the resource has received according to Scopus, CrossRef, and various other sources.
The totals for these metrics are displayed in a dashboard; bar charts or sunburst diagrams supplement a tabular view, and data is not only available at the level of individual resources, but also aggregated for individual researchers, resource types, and various levels of organisational unit (programmes, departments, whole organisations).[39] A ‘plum print’ summary is available for embedding into other sites, such as an institutional repository. The information shown in the embedded widget is customisable and links to the original data source are made available.
Researchers can help seed the information available by linking their PlumX profiles to accounts they have in other systems (e.g. Slideshare, GitHub).[40]
Example
When Jason Colditz wrote a blog post on Open Access publishing, he illustrated it with a flowchart of the publication process that he had deposited in figshare.[41] His institution’s PlumX profile tracks interest in the figure.[42]

Altmetric
Altmetric at a glance
- Collects altmetric statistics for an organisation’s scholarly outputs
- For: researchers, institutions, publishers
- Pricing: free for researchers, price on application for commercial/institutional licenses
- http://www.altmetric.com/
Altmetric is an article-centred service which monitors various sources for mentions of scholarly articles. These sources include Twitter, Facebook, blogs, newspaper sites and government policy documents. On the basis of this information it computes a score intended to indicate the quality and the quantity of the attention received. The score is calculated from the volume of mentions, with each mention weighted according to its source (with newspaper articles given more weight than tweets, for example), its author and its intended audience.
The output from Altmetric is available in four forms:
-
A web explorer. This brings together all the information gathered about all the articles. The articles and discussions around them can then be explored individually with different filters. Email alerts, custom reports and export are also available. A paid-for institutional offering collates information for articles from that institution.
-
A bookmarklet. The bookmarklet is free to researchers. It works within a browser and shows altmetrics for individual articles whilst they are being viewed. It is currently available for articles in PubMed and arXiv, and pages containing a DOI.
-
An API. The API requires a commercial license (although limited free use is on offer for non-commercial research, apps and mash-ups). The API is HTTP-based and gives programmatic access to the data about articles and datasets collected by Altmetric.
-
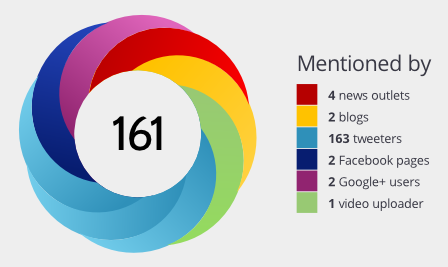
A badge. The badge is a doughnut-shaped visualisation which displays the altmetric score in the centre and colour-coded edges according to the source of mentions. Each one links to a landing page which shows the breakdown of the score for that article. HTML code is provided for embedding badges into arbitrary web pages, so researchers can add them to their own personal pages or institutions can integrate them into platforms such as repositories. One notable use is in PLoS Impact Explorer,[43] which uses the altmetric score to rank articles published by the Public Library of Science. The view may be configured using different time periods and subsets of articles. For each article it displays not only the altmetric badge but also a selection of comments harvested from social media.
Example
3D PDF images of a gigantic dinosaur ‘Dreadoughtus schrani’ were deposited in figshare.[44] This was picked up by the media. The various mentions in blogs, tweets, news outlets and other sources were tracked with Altmetric, which ranked the item in the top 5% of all items scored by them.[45]
ResearchGate Score
ResearchGate at a glance
- Counts citations for a portfolio of scholarly outputs, plus associated internal altmetrics
- For: researchers
- Pricing: free
- https://www.researchgate.net/
ResearchGate is a social networking site for researchers.[46] Users are encouraged to add their publications to their profile and the site generates statistics about views, downloads and citations. These statistics are presented to the user in a ‘dashboard’ display in their profile area on the website and emailed to them on a regular basis. The statistics also contribute to the service’s own impact metric, the RG score, alongside the researcher’s activity on the ResearchGate forums and the number of other users ‘following’ their profile.
Researchers can share data alongside publications. An open peer review feature, OpenReview, was recently added to the site. This allows the user to publish an open review of any paper they have read, according to a structure that focuses on whether the paper’s results are reproducible. Multiple reviews of the same paper can be compared from a summary page.[47] Users can also request reviews of papers.
Google Scholar and Microsoft Academic Search
Google Scholar at a glance
- Counts citations of scholarly outputs by scholarly outputs
- For: researchers
- Pricing: free
- http://scholar.google.com/
Google Scholar is a version of the Google search engine focused on scholarly works.[48] Among the facilities it provides is an enumeration of the citations each work has received from the others in the database. This information is automatically generated and therefore somewhat approximate, but researchers can get extra value from the service by setting up a profile and ‘claiming’ their scholarly works. Having done so, a profile page is created that lists the works alongside their respective citation counts. In addition, the page provides three aggregate statistics: the total count of citations the works have received, an h-index, and an i10-index, the latter being the number of works receiving at least 10 citations. All three measures are provided twice: the first counting all citations, the second only counting citations from the last five years. A bar chart of annual citation counts is provided.
Users with profiles are able to improve the accuracy of the service by curating the entries they have claimed (e.g. ensuring there are no duplicates or incorrectly merged entries, correcting bibliographic information) and adding others that Google may have missed.
Microsoft Academic Search at a glance
- Counts citations of scholarly outputs by scholarly outputs
- For: researchers
- Pricing: free
- http://academic.research.microsoft.com/
Microsoft Research provides a similar service called Microsoft Academic Search.[49] It too provides citation counts for the works in its database but, in contrast to Google Scholar, creates profile pages for all authors it discovers. Each profile page, as well as listing that author’s outputs, provides a total citation count and a line graph of annual citation counts. Users who have signed in are able to correct errors they find in the data: they are not restricted to editing those relating to themselves or their publications. Any conflicts between corrections are resolved by Microsoft.
Other services
SocialCite is a prototype service that uses crowdsourcing to gather more detailed information about individual citations, to help determine how they should contribute to measures of impact.[50] In the prototype service,[51] users indicate the appropriateness and evidence strength of a citation using a simple thumbs up or thumbs down rating. The service is unavailable at the time of writing.
PaperCritic is an open peer-review system built on top of Mendeley, the reference manager and social network.[52] It allows Mendeley users to add reviews of publications in their own or others’ reference collections. They can also rate the publication’s references, originality, argumentation, originality and difficulty, and indicate whether they would recommend it to others. While interesting as a model for post-publication peer review, it is unknown whether any datasets were reviewed using the service, and at the time of writing the service had not been updated to use the latest Mendeley API.
ReaderMeter queries the Mendeley service for information about the number of times a resource has been bookmarked, and uses it to generate metrics analogous to the h-index[53] and g-index (defined such that a researcher has index g if their g most cited papers have between them received at least g[2] citations[54]). The service is currently unavailable but indicates it may resume at some point.[55] Further information is available from the DCC.[56]
Crowdometer was a project that used crowdsourcing to analyse and classify tweets that link to scholarly papers.[57] Participants used a subset of the Citation Typing Ontology (CiTO) – terms such as ‘discusses the cited paper’ or ‘uses data presented in the cited paper’ – to describe the types of links made in the tweet. One main finding was that most tweets do not contain a sentiment about the link being shared. The project was carried out in between December 2011 and January 2012; while its website is no longer available, the code used is available from GitHub.[58]
![]()
Current issues and challenges
Immaturity of the area
Many of the tools available for measuring the impact of data are at an early stage of development. There is a wide variance in what they measure and some differences in how they measure it. For those tools aggregating from a large number of sources, it is unclear whether any attempt is made to deduplicate results (e.g. merging citations counted by both Scopus and Web of Science). The results of different tools are not, therefore, directly comparable with each other; depending on the rate of development of the tools and what they measure, they may not even be comparable with themselves over time.
Which measures are truly valuable and which are too noisy is still a matter of debate.[59] Put another way, it is not yet clear which are reliable measures of true impact and which are merely indicators of attention received.[60] It is arguable, for example, what proportion of the tweets about a resource represent real engagement with it, and what proportion are simply passing on an interesting title.[61] Among the available measures, traditional citation counts are highly regarded; even proponents of altmetrics recognise that cultural change and further work is required before funders put the same level of trust in alternatives, and recognise that outputs such as datasets are just as valuable as journal articles.[62]
Until some consensus is reached on an appropriate suite of metrics, it is unlikely they will be relied upon too heavily when apportioning rewards to researchers.[63] Even so, though currently available metrics may not be stable enough to judge relative impact, they can still be used on a case-by-case basis as evidence of impact in an absolute sense.
Altmetrics data is out there right now, and it’s building pictures – fuzzy though they may be – of impact that are richer, broader, and more nuanced than anything we’ve ever seen before. Right now, today, altmetrics can mean the difference between a story and ‘data-supported story’, and that’s a pretty important difference. – Jason Priem[64]
Impact versus quality
As discussed at the beginning of this guide, there is a distinction to be made between impact and quality. While the two are related, there are many more reasons why a resource might be impactful (or not) other than it being of high (or low) quality. David Colquhoun, for example, points out that papers whose titles and abstracts speak to popular concerns (e.g. diet, health, body parts) may be widely mentioned on social media regardless of quality.[65] Indeed, many of the academics who voice objections to the use of metrics, alternative and traditional, do so because they object to the emphasis shifting away from quality towards impact.[66] While researchers have a great deal of control over the quality of their outputs, the level of impact they receive, especially as judged by a set of metrics, depends on many factors outside their influence.
Nobody really knows exactly what it means, but what we’re scoring is attention, it’s not quality. […] At this stage it’s more about collecting the data and seeing what’s in there. – Euan Adie, Altmetric[67]
Gaming the system
Gaming of metrics can be described as ‘behaviour that is meant to unfairly manipulate those metrics, generally for one’s benefit.’[68] An example from traditional bibliometrics is the citation ring, where a group of authors agree to cite each other extensively, regardless of the actual mutual impact of the papers.[69] If tweets are considered evidence of impact, then setting up a hundred fake Twitter accounts to tweet about one’s work would be an example of gaming the system.[70] On the other hand, self-citation and tweeting about one’s own work would not be considered unethical; neither would a repository setting up an account that automatically tweets about new deposits. The consensus is still emerging on where the line lies between these two extremes of acceptable promotion and cheating, but even acceptable practices need to be recognised and factored into calculations.[71]
The effects of time
Given the time it takes to write a paper and bring it to publication, there is often a substantial lag between a resource being published and receiving its first citation. This is especially true in the Arts and Humanities, where publication cycles tend to be much longer than in the Sciences. With social media there is no such delay: the reaction can be almost instant. There is an argument, therefore, that altmetrics are more suited to measuring immediate impact, while traditional citations are more reliable for measuring longer-term impact. This is an easier argument to make for journal papers and monographs than data, as for the reasons outlined above datasets may not receive a representative number of citations.
It should be noted when taking a view of impact over long timescales that changes in the landscape will have a significant effect. Due to the growth in usage of services like Twitter and Facebook, the impact of resources measured in raw tweets and posts will naturally seem less the further back in time one goes, simply because there were fewer users. Similarly, as data citations become more commonplace, what we might consider a significantly high citation count today may seem, in raw numbers, to be relatively low in future.[72]
Over such long timescales, changes in understanding can also play a part, with some works being ignored for many years before becoming highly influential. In such circumstances, impact metrics may give an underestimate of the importance of a work, due to it having to ‘catch up’ with the impact accrued by other works published at the same time.
![]()
Tips for raising research data impact
Although a complete and seamless infrastructure of services and tools for the monitoring and measurement of the impact of data is not yet available, there are measures that can be taken now using existing facilities and elements of the infrastructure.
Deposit data in a trustworthy repository
The measures of impact discussed in this guide rely on a resource having a stable location that can be cited or quoted, or for which statistics might be collected. The most effective and straightforward way of achieving this stability is to deposit data in an appropriate custodial environment where it will be preserved and visible for the foreseeable future.
When choosing a repository with impact in mind, there are many different issues to consider:
- Is the repository reputable? Has it been certified as trustworthy? Is it recommended or required by my journal, institution or funder?
- Is the repository already well used by my peers? Will they be able to discover my data there?
- Will the repository review the data for quality?
- Will the repository provide a persistent, unique identifier (PUID) for my data?
- Will the repository collect usage statistics? Is it indexed or monitored by external services such as the Data Citation Index or ImpactStory?
For more guidance on choosing a repository, please see the DCC checklist ‘Where to Keep your Data: Key Considerations.’[73]
Provide appropriate metadata
For a dataset to have significant impact it must be discoverable, understandable and reusable. All three require data creators to provide additional information, or metadata, about the dataset.
Discovery metadata is information that will help others find the dataset. The most basic elements of discovery metadata are those one would find in a typical reference: title, creator, date, publisher, and a location or identifier. More advanced elements include an abstract, subject keywords, geospatial coverage, and temporal coverage. Precisely which elements are needed depends on the discipline and archive involved, but a good starting point is the DataCite Metadata Schema, which was designed as a cross-disciplinary discovery metadata standard.[74]
Representation information is information that would help a given set of users to understand the data. For tabular data, this might include information on how the data points were collected and what units were used. For coded data, it would include the code book. Such information also counts as metadata for reuse, the information that a reuser would need to extract new knowledge from the data, or combine it with other datasets. The most thorough (and useful) set of metadata to provide, though, is that which supports reproducibility. In an experimental context, this means the information needed to re-run the experiment so as to confirm the results. In an observational context, this means the information needed to derive again the final results from the raw data, or to collect new data that may legitimately be compared and contrasted with the original.
Again, the appropriate level of metadata to provide is highly context-dependant. Disciplinary norms and guidance on appropriate schema are sometimes available, and repositories or organisations often define minimum requirements for deposit. The DCC provides information on metadata standards that have been defined in various disciplines.[75] More specific advice is provided by, for example, BioSharing,[76] the Global Earth Observation System of Systems (GEOSS) Standards and Interoperability Registry (SIR),[77] and the Marine Metadata Interoperability (MMI) project’s Content Standard References.[78]
ORCID
Though still in its early stages, ORCID (Open Researcher and Contributor Identifer) is gaining traction as a way of identifying researchers across many different systems. By claiming an ORCID ID and associating it with your outputs wherever possible, you can prepare for future impact-tracking services that will be able to read your profile and search for uses of your ID online.
Enable open access
Another key factor for impact is accessibility. If researchers are prevented (or discouraged) from accessing data due to paywalls or other restrictions, the data will not have an impact on their work. Some restrictions are necessary, for example those arising from legal or ethical requirements; however, where restrictions are not needed, the data should be made open access.
Regardless of whether access restrictions are applied to data, it may be desirable to require user registration prior to access. Whilst registration does impose an extra step (and therefore a potential barrier) to data access, it can be used for tracking and monitoring patterns of data use. It also makes it easier to enforce any restrictions on use that pertain to the data, but again for maximum impact such restrictions should be the minimum necessary to comply with legal, ethical and other obligations.
Apply a licence to the data
If researchers are concerned about the legal implications of reusing data, it can inhibit the impact it has on their work. By applying a licence or waiver, data creators can provide an unambiguous statement about what uses are permitted, allaying such concerns. For more information about licensing data, please see the DCC guide ‘How to License Research Data.’[79]
Raise awareness
Depositing a dataset in a well used repository, or having it indexed in a popular discovery service, is a great first step to ensuring it is visible. To take things further, there are more direct ways to draw the attention of potential reusers to the dataset.
The first and most obvious one is to cite the dataset in any publications that draw on it. For more information on how to do this, please see the DCC guide ‘How to Cite Datasets and Link to Publications.’[80] Another possibility is to publish a data paper that describes the dataset; this is particularly valuable in disciplines where data citations are rarely published, but is worth considering in most contexts.
Less formal references can also be effective. Including references to the dataset within services such as Academia.edu, ResearchGate and Mendeley can help make it more visible to fellow users and to search engines. Similarly, mentioning the dataset in blog posts and on Twitter or Facebook can help bring greater attention to it; if there is a compelling story surrounding it, this can help propagate the message through the normal sharing mechanisms. In all such cases, it is important to include the dataset identifier as this makes it much easier for impact measurement tools to track how interest in the dataset spreads through social media.[81][82]
![]()
Notes
-
National Science Board. (2011). National Science Foundation’s merit review criteria: Review and revisions (Report No. NSB/MR-11-22). National Science Foundation. Retrieved from http://www.nsf.gov/nsb/publications/2011/meritreviewcriteria.pdf↩
-
Hodgson, S., & Porter, L. (2010, October 13). Pathways to impact. Presentation given to the University of Cambridge Research Operations Office. Retrieved from http://www.admin.cam.ac.uk/offices/research/documents/local/presentations/2010_10_13_NERC_Impact.pdf↩
-
Research Excellence Framework. (2011). Decisions on assessing research impact (Report No. REF 01.2011). HEFCE; SFC; HEFCW; DELNI. Retrieved from http://www.ref.ac.uk/media/ref/content/pub/decisionsonassessingresearchimpact/01_11.pdf↩
-
Higher Education Funding Council for England. (2014). Independent review of the role of metrics in research assessment. Retrieved from http://www.hefce.ac.uk/rsrch/metrics/↩
-
Kansa, E. (2014, January 27). It’s the neoliberalism, stupid: Why instrumentalist arguments for Open Access, Open Data, and Open Science are not enough. Retrieved from http://blogs.lse.ac.uk/impactofsocialsciences/2014/01/27/its-the-neoliberalism-stupid-kansa/↩
-
Jones, C. (2014, December 02). RDMF12: Notes from breakout group 4 (tracking uses). Retrieved from /blog/rdmf12-notes-breakout-group-4↩
-
Engineering and Physical Sciences Research Council. (2014). Clarifications of EPSRC expectations on research data management. Retrieved from http://www.epsrc.ac.uk/files/aboutus/standards/clarificationsofexpectationsresearchdatamanagement/↩
-
The document states it is ‘reasonable to use data citations, or any other metric based on reliable sources of evidence and widely accepted at the time, to evaluate if interest has been shown in a dataset’ (Expectation VII).↩
-
Costas, R., Meijer, I., Zahedi, Z., & Wouters, P. (2013). The value of research data: Metrics for datasets from a cultural and technical point of view. Retrieved from http://www.knowledge-exchange.info/datametrics↩
-
Hicks, D., Wouters, P., Waltman, L., Rijcke, S. de, & Rafols, I. (2015). Bibliometrics: The Leiden Manifesto for research metrics. Nature, 520, 429–431. doi:10.1038/520429a↩
-
Hirsch, J. E. (2005). An index to quantify an individual’s scientific research output. Proceedings of the National Academy of Sciences of the United States of America, 102, 16569–16572. doi:10.1073/pnas.0507655102↩
-
Variations on the JIF are possible; for example, the JCR also provides a Five-Year Impact Factor which may be more relevant for disciplines with longer publication cycles.↩
-
Biotechnology and Biological Sciences Research Council. (2012). BBSRC policy on maximising the impact of research. Retrieved from http://www.bbsrc.ac.uk/documents/bbsrc-impact-policy-pdf/↩
-
Wesolek, A. (2014). Metrics: Understanding your impact. Retrieved from http://libguides.clemson.edu/metrics↩
-
Costas, R., Meijer, I., Zahedi, Z., & Wouters, P. (2013). The value of research data: Metrics for datasets from a cultural and technical point of view. Retrieved from http://www.knowledge-exchange.info/datametrics↩
-
Research Objects, URL: http://www.researchobject.org.↩
-
Journal of Open Archaeology Data, URL: http://openarchaeologydata.metajnl.com/.↩
-
DataCite Statistics, URL: http://stats.datacite.org/.↩
-
VectorBase, URL: https://www.vectorbase.org/.↩
-
Costas, R., Meijer, I., Zahedi, Z., & Wouters, P. (2013). The value of research data: Metrics for datasets from a cultural and technical point of view. Retrieved from http://www.knowledge-exchange.info/datametrics↩
-
Twitter, URL: http://twitter.com/.↩
-
Beal, E. (2014, September 26). Retrieved from https://twitter.com/bumblebeal/status/515460734516727808↩
-
Mendeley, URL: http://www.mendeley.com/. CiteULike, URL: http://www.citeulike.org/. BibSonomy, URL: http://www.bibsonomy.org/. Delicious, URL: https://delicious.com/.↩
-
Digg, URL: http://digg.com/. Reddit, URL: http://www.reddit.com/.↩
-
Faculty of 1000, URL: http://f1000.com/. PubPeer, URL: https://pubpeer.com/.↩
-
Earth System Science Data Discussions, URL: http://www.earth-syst-sci-data-discuss.net/papers_in_open_discussion.html.↩
-
Marjan Grootveld, J. van E. (2012). Peer-reviewed open research data: Results of a pilot. International Journal of Digital Curation, 7(2), 81–91. doi:10.2218/ijdc.v7i2.231↩
-
Herther, N. K. (2012). Thomson Reuters tackles open access datasets with Data Citation Index. NewsBreaks. Retrieved from http://newsbreaks.infotoday.com/NewsBreaks/Thomson-Reuters-Tackles-Open-Access-Datasets-With-Data-Citation-Index-85849.asp↩
-
Thomson Reuters. (2012). Repository evaluation, selection, and coverage policies for the Data Citation Index within Thomson Reuters Web of Knowledge. Retrieved from http://wokinfo.com//products_tools/multidisciplinary/dci/selection_essay/↩
-
ImpactStory, URL: https://impactstory.org/.↩
-
Holly Bik’s ImpactStory profile – datasets, URL: https://impactstory.org/HollyBik/products/datasets↩
-
PLoS ALM website, URL: http://article-level-metrics.plos.org/alm-info/↩
-
ALM Reports website, URL: http://almreports.plos.org/↩
-
Lagotto (Article-Level Metrics) source code repository, URL: https://github.com/mfenner/lagotto↩
-
Fenner, M. (2011, September 28). Announcing ScienceCard. Retrieved from http://blogs.plos.org/mfenner/2011/09/28/announcing-sciencecard/↩
-
Lin, J., & Fenner, M. (2014, February 24). One step closer to article-level metrics openly available for all scholarly content. Retrieved from http://articlemetrics.github.io/blog/2014/02/24/alms/↩
-
PlumX website, URL: http://plu.mx/.↩
-
Harris, S. (2014). Acquisition opens up altmetrics options. Research Information. Retrieved from http://www.researchinformation.info/features/feature.php?feature_id=490↩
-
Example PlumX profile for the University of Pittsburgh, URL: https://plu.mx/pitt/.↩
-
Michalek, A. (2014, July 31). Plum Analytics and our approach to altmetrics. Retrieved from http://bit.ly/PlumW923↩
-
Colditz, J. (2012). Publication process with oA. doi:10.6084/m9.figshare.91458↩
-
PlumX profile for the figure ‘Publication Process with OA’, URL: https://plu.mx/a/22ogwhQ4i9naHqqVVtbKuB8m1MoJ9sfe83lmONsd_u0↩
-
PLoS Impact Explorer, URL: http://www.altmetric.com/demos/plos.html.↩
-
Lacovara, K. (2014). Dreadnoughtus schrani 3D PDF images: Lacovara et al., 2014, A gigantic, exceptionally complete titanosaurian sauropod dinosaur from southern Patagonia, Argentina, Scientific Reports. doi:10.6084/m9.figshare.1130885↩
-
Altmetric page for Dreadnoughtus schrani 3D PDF images, URL: http://www.altmetric.com/details/2653335#score↩
-
ResearchGate, URL: https://www.researchgate.net/.↩
-
Example of a ResearchGate OpenReview summary, URL: http://tinyurl.com/ouc2orv.↩
-
Google Scholar, URL: http://scholar.google.com/.↩
-
Microsoft Academic Search, URL: http://academic.research.microsoft.com/.↩
-
Anderson, K. (2013, November). SocialCite. Presentation given at the HighWire Press Publishers Meeting, Washington, DC. Retrieved from http://www.slideshare.net/kentanderson/socialcite-makes-its-debut-at-the-highwire-press-meeting↩
-
Archive of the SocialCite website, URL: http://web.archive.org/web/*/social-cite.org.↩
-
PaperCritic, URL: http://www.papercritic.com/.↩
-
Hirsch, J. E. (2005). An index to quantify an individual’s scientific research output. Proceedings of the National Academy of Sciences of the United States of America, 102, 16569–16572. doi:10.1073/pnas.0507655102↩
-
Egghe, L. (2013). Theory and practise of the g-index. Scientometrics, 69(1), 131–152. doi:10.1007/s11192-006-0144-7↩
-
ReaderMeter, URL: http://readermeter.org/.↩
-
Digital Curation Centre. (2013, July 10). ReaderMeter. Retrieved from /resources/external/readermeter↩
-
Archive of the Crowdometer website, URL: http://web.archive.org/web/*/crowdometer.org/.↩
-
Crowdometer source code repository, URL: https://github.com/mfenner/crowdometer↩
-
Costas, R., Meijer, I., Zahedi, Z., & Wouters, P. (2013). The value of research data: Metrics for datasets from a cultural and technical point of view. Retrieved from http://www.knowledge-exchange.info/datametricsNational Information Standards Organization. (2014). Alternative Metrics Initiative phase 1 White Paper (White Paper). Retrieved from http://www.niso.org/apps/group_public/download.php/13809/Altmetrics_project_phase1_white_paper.pdf↩
-
Knowledge Exchange. (2013). Report Knowledge Exchange workshop: Making data count – research data and research assessment. Retrieved from http://www.knowledge-exchange.info/Default.aspx?ID=576↩
-
Colquhoun, D. (2014, June 18). Should metrics be used to assess research performance? A submission to HEFCE. Retrieved from http://www.dcscience.net/?p=6636↩
-
Konkiel, S., Piwowar, H., & Priem, J. (2014). The imperative for open altmetrics. Journal of Electronic Publishing, 17(3). doi:10.3998/3336451.0017.301↩
-
Featherstone, R. M. (2014). Scholarly tweets: Measuring research impact via altmetrics. Journal of the Canadian Health Libraries Association, 35, 60–63. Retrieved from http://ejournals.library.ualberta.ca/index.php/jchla/article/view/22907/↩
-
National Information Standards Organization. (2012, November). NISO Webinar: Beyond publish or perish: Alternative metrics for scholarship. Retrieved from http://www.niso.org/news/events/2012/nisowebinars/alternative_metrics/↩
-
Colquhoun, D. (2014, June 18). Should metrics be used to assess research performance? A submission to HEFCE. Retrieved from http://www.dcscience.net/?p=6636↩
-
Burrows, R. (2013, April 23). Living with numbers? Metrics, algorithms and the sociology of everyday life. Inaugural lecture at Goldsmiths, University of London. Retrieved from http://www.gold.ac.uk/made-in-goldsmiths/Colquhoun, D. (2014, January 16). Why you should ignore altmetrics and other bibliometric nightmares. Retrieved from http://www.dcscience.net/?p=6369↩
-
Laursen, L. (2012). Alternative research metrics. Science Careers. doi:10.1126/science.caredit.a1200124↩
-
National Information Standards Organization. (2014). Alternative Metrics Initiative phase 1 White Paper (White Paper). Retrieved from http://www.niso.org/apps/group_public/download.php/13809/Altmetrics_project_phase1_white_paper.pdf↩
-
Ferguson, C., Marcus, A., & Oransky, I. (2014). Publishing: The peer-review scam. Nature, 515, 480–482. doi:10.1038/515480a↩
-
Haustein, S., Bowman, T. D., Holmberg, K., Tsou, A., Sugimoto, C. R., & Larivière, V. (n.d.). Tweets as impact indicators: Examining the implications of automated “bot” accounts on Twitter. Journal of the American Society for Information Science and Technology. doi:10.1002/asi.23456↩
-
Featherstone, R. M. (2014). Scholarly tweets: Measuring research impact via altmetrics. Journal of the Canadian Health Libraries Association, 35, 60–63. Retrieved from http://ejournals.library.ualberta.ca/index.php/jchla/article/view/22907/↩
-
Thelwall, M., Haustein, S., Larivière, V., & Sugimoto, C. R. (2013). Do altmetrics work? Twitter and ten other social web services. PLoS ONE. doi:10.1371/journal.pone.0064841↩
-
Whyte, A. (2015). Where to keep your data: Key considerations (Checklist). Retrieved from /resources/how-guides/↩
-
DataCite, Metadata Working Group. (2014). DataCite metadata schema for the publication and citation of research data. doi:10.5438/0010↩
-
DCC Disciplinary Metadata Standards, URL: /resources/metadata-standards.↩
-
BioSharing, URL: https://www.biosharing.org/.↩
-
GEOSS SIR, URL: http://seabass.ieee.org/groups/geoss/.↩
-
MMI Content Standard References, URL: https://marinemetadata.org/conventions/content-standards.↩
-
Ball, A. (2014). How to license research data (How-To Guide). Retrieved from /resources/how-guides/license-research-data↩
-
Ball, A., & Duke, M. (2011). How to cite datasets and link to publications (How-to Guide). Retrieved from /resources/how-guides/cite-datasets↩
-
Featherstone, R. M. (2014). Scholarly tweets: Measuring research impact via altmetrics. Journal of the Canadian Health Libraries Association, 35, 60–63. Retrieved from http://ejournals.library.ualberta.ca/index.php/jchla/article/view/22907/↩
-
National Information Standards Organization. (2014). Alternative Metrics Initiative phase 1 White Paper (White Paper). Retrieved from http://www.niso.org/apps/group_public/download.php/13809/Altmetrics_project_phase1_white_paper.pdf↩
![]()
Further information
Three other DCC guides are related to this topic:
-
Working level: ‘How to Cite Datasets and Link to Publications’ by Alex Ball and Monica Duke
-
Working level: ‘How to License Research Data’ by Alex Ball
-
Working level: ‘Where to Keep your Data: Key Considerations’ by Angus Whyte
The following may also be of interest.
-
Dean, A., Wykes, M., & Stevens, H. (Eds.). (2013). 7 essays on impact. Retrieved from http://www.exeter.ac.uk/media/universityofexeter/research/inspiringresearch/describeproject/pdfs/2013_06_04_7_Essays_on_Impact_FINAL.pdf
-
Konkiel, S., Dalmau, M., & Scherer, D. (2015). Altmetrics and analytics for digital special collections and institutional repositories. doi:10.6084/m9.figshare.1392140
-
MacGillivray, M. (2012, December 12). Metrics for repository impact. Retrieved from http://www.rsp.ac.uk/events/impact-metrics-for-repositories/
-
Neylon, C. (2014, October 3). Altmetrics: What are they good for? Retrieved from http://blogs.plos.org/opens/2014/10/03/altmetrics-what-are-they-good-for/
-
National Information Standards Organization. (2012, November). NISO Webinar: Beyond publish or perish: Alternative metrics for scholarship. Retrieved from http://www.niso.org/news/events/2012/nisowebinars/alternative_metrics/
-
National Information Standards Organization. (2014, June). NISO Virtual Conference: Transforming assessment: Alternative metrics and other trends. Retrieved from http://www.niso.org/news/events/2014/virtual/assessment/
-
Penfield, T., Baker, M. J., Scoble, R., & Wykes, M. C. (2014). Assessment, evaluations, and definitions of research impact: A review. Research Evaluation, 23, 21–32. doi:10.1093/reseval/rvt021
-
Piwowar, H. A., & Vision, T. J. (2013). Data reuse and the open data citation advantage. PeerJ, 1, e175. doi:10.7717/peerj.175
-
Public Libary of Science. (2012). Altmetrics collection. Retrieved from http://www.ploscollections.org/altmetrics
-
Strasser, C. (2013, October 15). Universities can improve academic services through wider recognition of altmetrics and alt-products. Retrieved from http://blogs.lse.ac.uk/impactofsocialsciences/2013/10/15/universities-can-improve-academic-services-through-altmetrics/
-
Tattersall, A., & Beecroft, C. (2014, September). Altmetrics in the academy: Strategies for better academic engagement, dissemination and measurement. Presentation given at the Social Media for Researchers symposium, Sheffield Hallam University. Retrieved from http://t.co/2jPWTLeJJO
-
UK Data Service. (n.d.). Data impact blog. Retrieved from http://blog.ukdataservice.ac.uk/
-
Utrecht University Library. (2015). Research impact and visibility: Traditional and altmetrics. Retrieved from http://libguides.library.uu.nl/researchimpact
![]()
Acknowledgements
Thank you to Robin Burgess (Glasgow School of Art), Eric Kansa (Open Context), David Kernohan (Jisc), Paolo Missier (Newcastle University), Linda Naughton (Jisc), and Angus Whyte (DCC) for helpful comments.